Counted inputs and claimed returns
The cost of administrative work in healthcare is measured carefully, and mostly by people with nothing to sell. CAQH, drawing on 600 organizations covering 63% of insured lives, puts a provider's time at 11 minutes for an electronic prior authorization and 16 minutes through a health plan portal, at roughly six dollars per transaction under the HIPAA standard. The American Medical Association's June 2025 survey of 1,000 practicing physicians found practices completing about 40 prior authorizations per physician each week across 13 hours of physician and staff time. Premier surveyed 280 hospitals in 23 states and found a denial costing $57.23 to work, up from $43.84 a year earlier.
The savings side has nothing of that quality. The figures in circulation for AI coding accuracy, coder productivity, denial prevention, no-show reduction and call deflection trace back to vendor material, single-site case studies, or customer surveys the vendor commissioned. Independent, peer-reviewed or government-audited measurements of AI coding accuracy or denial-prevention impact are absent from the published record.
The pattern holds even where the publisher is credible. The American Hospital Association reported in June 2024 that Auburn Community Hospital, a 99-bed rural facility in New York, credited automation with a 50% reduction in discharged-not-final-billed cases, a coder productivity gain above 40% and about $1 million to the bottom line, and that Fresno Community Health Care Network saw a 22% decrease in prior authorization denials from commercial payers. Both are the buyer's own account of software the buyer purchased, with no control period published. Treat them as hypotheses worth testing locally. The most confidently quantified corner of healthcare AI is also the least independently verified.
What was measured under subpoena
One body has measured administrative automation in healthcare with the power to compel the evidence. In October 2024 the US Senate Permanent Subcommittee on Investigations published Refusal of Recovery, built on more than 280,000 pages obtained from UnitedHealthcare, Humana and CVS. It found UnitedHealthcare's initial denial rate for post-acute care prior authorization rising from 8.7% in 2019 to 22.7% in 2022, an increase of 172%, while the company's overall prior authorization denial rate moved from 7.3% to 7.6% across the same period.
The skilled nursing figures are sharper still. UnitedHealthcare denied 1.4% of skilled nursing admission requests in 2019 and 12.6% in 2022, nine times the earlier rate, in the first full year that its subsidiary naviHealth managed those requests. Humana's denial rate for long-term acute care hospitals, the most expensive form of post-acute care, grew 54% between 2020 and 2022.
The mechanism sits in the internal documents. In early 2021 UnitedHealthcare tested what it called an HCE Auto Authorization Model. Minutes from the committee reviewing it recorded "faster handle times" alongside "an increase in adverse determination rate", which the committee attributed to "finding contraindicated evidence missed in the original review". It voted to tentatively approve the model the following month. In April 2021 a separate committee approved "Machine Assisted Prior Authorization", having been told that testing cut average review time by six to ten minutes.
Read that as an engineering record. The system was scored on handling time. The movement in denial rate appeared in the same minutes, carried an explanation, and went forward. It remains the most rigorously documented deployment of administrative AI in American healthcare, and the rigor came from a subpoena.
Faster is a number with an owner
The rules moved the clock. Under CMS-0057-F, from January 1, 2026 Medicare Advantage organizations, state Medicaid and CHIP fee-for-service programs and Medicaid and CHIP managed care plans must decide expedited prior authorization requests within 72 hours and standard ones within seven calendar days, and must give a specific reason for every denial. By January 1, 2027 the same payers must run a Prior Authorization API alongside three others. CMS priced the package at roughly $15 billion in savings over ten years.
The provision that produced new evidence is the quietest one. Impacted payers must publish prior authorization metrics on their own websites annually, with the first set due by March 31, 2026. In August 2026 KFF used that newly public data to compare the largest insurers and found average standard denial rates of 12% in Medicare Advantage, 14% in Medicaid managed care and 18% in the ACA marketplace, with the range running from 5% to 17% inside Medicare Advantage alone and from 3% to 25% in the marketplace.
A spread that wide across the same regulated product is a measurement problem before it is anything else. It also frames every speed claim that follows. A system closing prior authorizations faster has improved a number owned by the payer. Whether the same change improved anything for the patient is a separate measurement, and it has to be taken separately.
The exception path is the job
In June 2026 the HHS Office of Inspector General reviewed 19 Medicare Advantage organizations and their skilled nursing facility prior authorization decisions from June 2024. The organizations denied 12% of admission requests, with rates spanning 0.4% to 23%. Enrollees and providers appealed 18% of those denials. The organizations then overturned 95% of the appeals in the enrollee's favor. A single contractor handled half of all such requests, denied 14%, and reversed 97% of what was challenged. Nationally, KFF counted 52.8 million determinations in 2024, 7.7% denied, 11.5% of denials appealed and 80.7% of appeals overturned.
The engineering reading is plain. A decision system was reversed almost every time anyone checked it, and it was checked in fewer than one case in five. The four unchecked cases carry both the cost and the harm, and no dashboard counts them. Premier's hospitals found the same shape from the provider side: 70% of initially denied claims were eventually paid, after roughly three rounds of appeal at 45 to 60 days each.
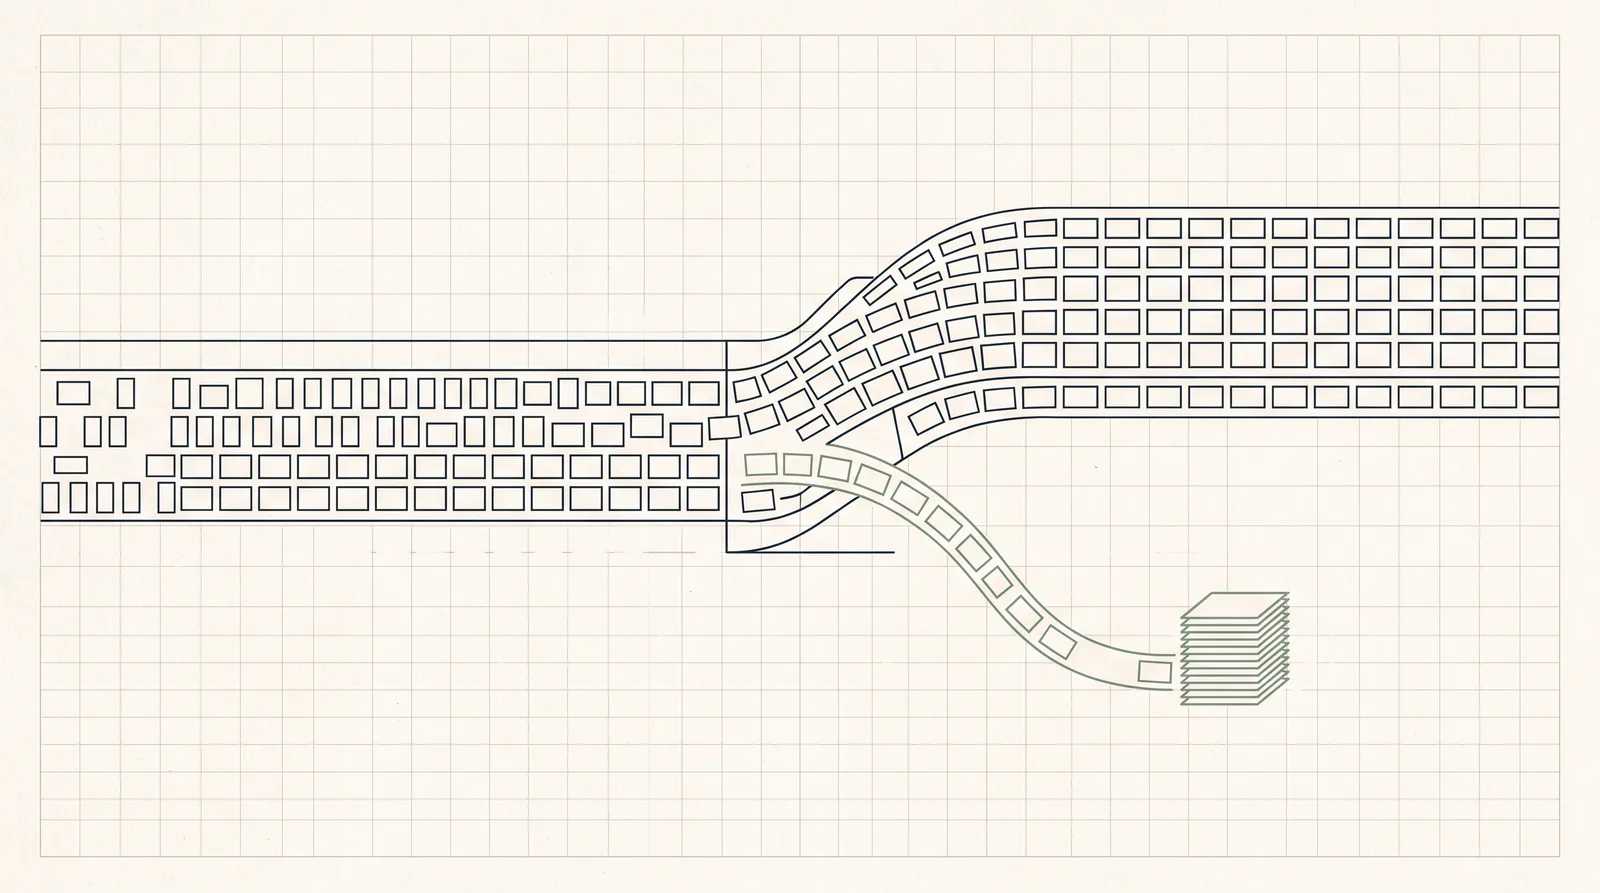
Every automation leaves this residue. A system that closes 60% of requests cleanly hands the other 40% to a human desk, often in worse condition, because a machine assembled the case and the person finishing it has to reconstruct why. The measurements that matter are the exception queue's volume, its age profile, human touches per case, and the outcome once a person completes it. A pilot reporting only its automation rate has reported half a number, and the omitted half is the half that decides the business case.
The fastest scalers measure worst
Deloitte's Center for Health Solutions surveyed 64 US healthcare finance leaders in spring 2026, split evenly between health systems above $1 billion in revenue and health plans above 500,000 members. It classified 44% as AI scalers. Among those scalers, 18% reported mature financial attribution capability, against 31% of organizations still at the starter stage. Sixty-eight percent of scalers leaned primarily on before-and-after comparison for at least some initiatives. The sample is 64 people and deserves to be read as one.
The direction matches the wider evidence. Bain and KLAS surveyed 228 US provider and payer executives in October 2025 and found 70% of providers and 80% of payers holding an AI strategy, with many saying it remained early to quantify precise financial returns. The Peterson Health Technology Institute, after interviewing leaders at large health systems in March 2025, concluded that ambient documentation likely eases clinician burden while evidence on productivity and financial performance stays thin.
MIT's Project NANDA report, drawn from research between January and June 2025 across more than 300 public initiatives, 52 structured interviews and 153 surveyed leaders, reported 95% of organizations getting zero measurable return six months after a generative AI pilot. Its methodology has been publicly contested and its own authors record selection bias among the limitations, so the headline is a direction. The finding underneath it travels better: half of AI budgets went to sales and marketing while the clearest cost reductions came from back-office automation, and those reductions showed up as cancelled outsourcing contracts with team structures unchanged.
How to get a real number
That last detail is the practical one. The administrative returns that proved checkable were the ones that landed on a line item finance already tracked. In a health system the equivalent is the outsourced coding contract, the AR follow-up vendor, the overtime ledger in patient access. A saving that can be traced to a contract that stopped renewing survives a review; a saving expressed as reclaimed minutes across a hundred people rarely does.
Three measurements make the case auditable. A baseline taken before anything is installed, over a window long enough to contain a month-end close and at least one payer policy change. A fully loaded cost per unit, covering license, integration, monitoring, retraining and the labor spent on exceptions, divided by transactions closed. And the fraction genuinely completed end to end with no human touch, defined in advance and audited by sampling, because vendors and internal teams share an incentive to count a case as automated when a person quietly finished it.
Add the exception queue to the same scoreboard and the picture closes. Volume, age, touches per case, and the outcome once a person takes over. Those are the numbers that separate a system that removed work from one that moved it.
None of this requires waiting for the independent literature to arrive. It requires running the measurement yourself, agreeing it before the build, and keeping it reporting long after go-live, because payer policies change quarterly and denial reason codes retire. The organizations that will know what their administrative AI is worth in 2028 are the ones instrumenting it now.
What we do about the missing evidence
We work in this category, so the gap above is our problem too. The response is to treat the client’s own baseline as the only benchmark that counts. An industry average measured somewhere else, on someone else’s payer mix and someone else’s staffing, forecasts their operation.
Four numbers get agreed before anything is built. The baseline, taken over a window long enough to contain a month-end close and at least one payer policy change. The fully loaded cost per case, inference and review and rework included. The share of volume the system closes end to end with no human touch. And the exception queue on the same scoreboard as the rest — its volume, its age, and what happens once a person picks it up.
A smaller number that survives a finance review is worth more to both sides than a larger one that collapses under it. That is the trade we make deliberately, and it is why our proof gate is scored on figures fixed in advance. A technology with four legitimate success metrics offers four chances to pick the flattering one once the result is in.